|
~
TRENDLines Research's
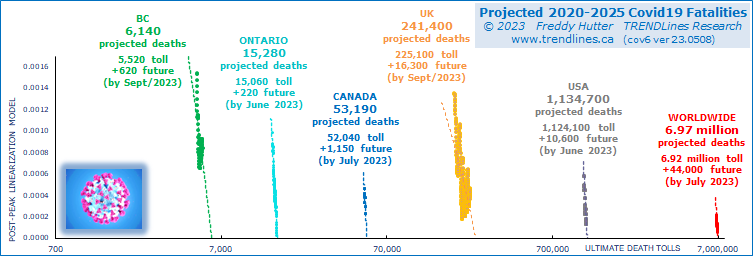
Covid Future Fatalities Projections

"future deaths" chart also viewable at: www.twitter.com/TrendlinesDotCa
& www.facebook.com/TRENDLinesResearch
next monthly chart update: June 6th 2023
|
OMICRON'S SUB-VARIANTS' GLOBAL WAVE HERE 'TIL JUNE 2023!
PROJECTED FUTURE FATALITIES: 44,000 WORLDWIDE
incl: USA 10,600 & UK 16,300 & CANADA 1,150 (incl 220 ONTARIO & 620 BC VICTIMS)
May 8th 2023 - Based on novel coronavirus's ever-changing
mortality rate in recent weeks, today's update
of TRENDLines Research's
Covid-19 fatalities
model projects an ultimate 2020-2023 death count of 6.97
million worldwide (present toll 6.92 million + 44,000 future) incl 1,134,000 in the
USA (1,124,000 toll + 10,600 future); 241,400 in the UK (225,100 toll + 16,300 future) & 53,190
in Canada (52,040 toll + 1,150 future) incl 15,280 in Ontario (15,060
toll
+ 220 future) & 6,140 in BC (5,520 toll + 620 future) - based on
current relaxed policymaker mitigation of the Omicron BA2/4/5, BQ1 & XBB1 sub-variants.
Whereas
previous lethal coronavirus events (MERS & SARS) were relatively
short-lived due to aggressive contact tracing, misguided policymaker mitigation decisions allowed Covid-19 to become
a multi-wave pandemic with a projected 43 month start-to-end duration (assuming no new variants-of-concern).
This humankind
disaster stems
from most jurisdictions: (a) adopting the horrific Trump strategy of
prematurely lifting restrictions (thrice or more); (b) reluctance to
require/maintain shelter-in-place; (c) an over-reliance on
vaccination programs; (d) failure to assist vaccination in
developing nations; (e) identifiable
leadership complicity in anti-mandate campaigns (eg masks, testing, social distancing &
vaccinations); & (f) virtually abandoning vigilant testing &
contact tracing convention post Delta.
note: text below reflects June 30 2022 Report
- balance of text will updated later this month!
- see archive of past projection in table below
These
failures to isolate the original virus led to successive
surges of same and provided opportunities for spawning Alpha, Beta, Delta & Omicron
(incl BA2/4/5) variants-of-concern to flourish. Modelling
reveals this event
should have been only a mere six-month episode with 1.1 million
fatalities.
Instead, policymaker hubris may have
caused 5.3 million unnecessary victims worldwide. These surplus
deaths include 870K in USA, 149K in UK & 29K in Canada (incl 10K in
Ontario & 2,900 in BC).
My Post-Peak Linearization Model indicated prudent mitigation
efforts had essentially suppressed Covid's first surge by mid-2020 in
the UK & Canada (incl Ontario & BC.
Unfortunately, those early lock-down & shelter-in-place sacrifices proved to be in
vain. Premature relaxation
of Orders and restrictions in all four jurisdictions gave rise to new
surges upon each
attempt at re-opening. Similarly, just as the USA & Global models were to
signal suppression in July 2021, the Delta wave overwhelmed the suppression progress.
In much of the world,
similar policymaker mismanagement resulted in a string of five waves
(defined as
seasonal outbreaks or material strain mutations): Covid19 original strain,
Alpha/Beta, Delta, Omicron & its BA2/4/5 sub-variants and surges within
those waves.
As a "post-peak" model, no
projections
were generated during the strong Delta & Omicron episodes.
Surges in cases, hospitalizations, ICU and deaths since mid 2021 reigned
primarily in vax-hesitant regions. Excepting developing nations
lacking vaccination access, one might surmise there was a lot of
Darwin's natural selection at
work - and fortunately - victims were/are mostly right-wing qAnons.
Originally, consensus held
natural & community (vaccinated) herd immunity would
kick
in upon regions attaining 67% infection and/or jabs. But failure
to suppress the original strain and the subsequent spawning of
variants-of-concern, broad-based vaccine hesitancy & the inability
of vaccines to prevent break-thru cases upon waning immunity appear to
have killed off any hope of illusive herd immunity.
Current
model runs indicate Omicron's sub-variants will transition to endemic
status (health sector no longer overwhelmed) over the coming weeks and
months. In early June 2022, the UK became the first of our six
tracked jurisdictions to attain endemicity. Covid related deaths
should wind down by late July in the UK; by September in
Ontario; October Canada-wide; March 2023 in BC; & June
2023 in the USA. However, with 33% of the globe still lacking even
a first jab, it is
highly probable new variants-of-concern will arise this Autumn.
See website table for archive of all my projections since April 2020. The model's composite chart, underlying stats
& analyst commentary (by Freddy Hutter) are updated monthly at:
www.trendlines.ca & chart only at www.facebook.com/TRENDLinesResearch
& www.twitter.com/TRENDLinesDotCa
WORLDWIDE analysis
Based on existing lax policymaker mitigation and mortality
trends in recent weeks, the TRENDLines Post-Peak Linearization Model
projects Omicron's sub-variants (BA2/4/5) will claim yet another 98,000
fatalities
across the
globe as the present wave expires in February 2023. Added
to the current toll (6.322 million), an ultimate 6.420 million victims are projected over 2020-2023. Today's
daily-deaths rate (1,400) is down 90% from its January 2021 record high
(14,400). Today 63% of the world's population have at least one
jab. Future variants-of-concern may inflate final numbers.
Troubling as today's ultimate
projection may be, the alternative natural herd immunity strategy promoted
by conspirators would have cost 102 million lives (7.6 billion x 67% x
2.0% Alpha/Beta case fatality rate) and with no guarantee of permanent immunity.
The
10 nations with the highest daily-deaths rate today: USA (260),
Brazil, Taiwan, UK, Russia, Australia, France, India, Chile
& Canada.
The model reveals 5.2 million souls (of 6.4 mil total) will have
perished unnecessarily due to misguided policymaker decisions to
prematurely re-open.
41% of worldwide victims resided in long-term care facilities.
Worldwide mortality rate: 0.08% or 813 deaths/million population
USA analysis
The
model similarly projects Omicron's sub-variants (BA2/4/5) will claim yet
another 24,400 fatalities across America as the present wave expires in June 2023 -- based on existing policymaker mitigation. Added
to the current toll (1,025,900), an ultimate 1,050,300 victims are projected over 2020-2023. Future variants-of-concern may inflate final numbers.
Today's daily-deaths rate (260) is 93% below its Jan/2021 record high (3,500). The States with the most daily-deaths today
are Florida (60), California, Georgia, Pennsylvania, New York & Texas.
Troubling as today's ultimate projection may be, the absurd natural herd immunity policy promoted by the Trump White House would have cost 3.9 million American lives (327 million x 67% x 1.8% Alpha/Beta case fatality rate) with no guarantee of permanent immunity.
During a White House Rose Garden
virtual town hall on
March 25th 2020, the former President proposed packing the nation's churches on
Easter and return to work the following day. It was on this
precise day America
was infected with "the TrumpVirus". On that day the USA had
only 4% of global Covid deaths - apropos considering the nation has 4% of the
world's population.
It marked the day everything
changed. For context of Trump's containment failure, the USA had over
half of worldwide cases & deaths in 2020. Twenty-six months later,
the USA still has 16%
of world's cumulative Covid
cases, 16% of the today's global "active" cases & 16% of worldwide body bags. The uncontained TrumpVirus resulted in GDP crashing at a historic -31%
pace in 20Q2. 75 million workers initiated unemployment claims due to the
pandemic during his term.
The President caused a TrumpVirus resurgence only for the purpose of salvaging his legacy. He
desperately wanted to avoid voters going to the polls realizing The Donald (alone)
was at fault for April 2020's 22% U-6 Unemployment Rate & plunging
the U.S. economy into its deepest crash (-31% GDP) ever - including the Great Depression.
The model reveals reveals 870,000 souls (of 1,050,000 total) will have perished unnecessarily due to
misguided policymaker decisions to prematurely re-open.
Long-term
care residents comprise 1% of the USA population but were 36% of
Covid19 victims - as high as 73% in some States. 81% of fatalities
were over the age of 64 and 95% were over 49.
USA's mortality rate: 0.30% or 3,009 deaths/million -- 17th worst in world - behind
Peru (0.66%), Bulgaria, Bosnia-Herzegovina, Hungary, Georgia, North
Macedonia, Croatia, Czechia, Slovakia, Romania, Moldova, Lithuania, Brazil, Slovenia, Poland & Chile.
UK analysis
The model
projects Omicron's sub-variants (BA2/4/5) will claim yet another 680 fatalities
across the UK as the present wave expires in late July -- based on
existing lax policymaker mitigation. Added to the
current toll (199,420), an ultimate 200,100 victims are projected over
2020-2022. Future variants-of-concern may inflate final numbers.
The UK's
wave#1 was initially suppressed back on Aug 2nd 2020 - when new daily
cases
sunk below 750 and daily deaths were down to single digits. The model
deemed wave#1 suppressed a second time (late May 2021) when once again
daily-deaths hit single digits. Today's daily-deaths rate (29) is 98% below its Jan/2021 record high (1,250).
Troubling as today's ultimate
projection may be, the alternative natural herd immunity strategy promoted by conspirators would have cost 757,000 UK lives (66 million x 67% x 1.7% Alpha/Beta case mortality rate) with no guarantee of permanent immunity.
The model reveals 149K souls (of 200,100 total) will have perished
unnecessarily due to misguided policymaker decisions to prematurely
re-open.
The
UK comprises only 1% of global population but has 3% of the Covid19
deaths (down from 11% in 2020) and 4% of today's world "active" cases.
37% of victims lived in long-term care homes.
UK's mortality rate: 0.26% or 2,555 deaths/million (28th worst in world)
CANADA analysis
The model
projects Omicron's BA2/4/5 sub-variants will claim yet another 730 fatalities
across Canada as the present wave expires in October -- based on
existing lax policymaker mitigation. Added to the current toll (41,570), an ultimate 42,300 victims are projected over 2020-2022. Future variants-of-concern may inflate final numbers.
The model reveals Canada's wave#1 was initially suppressed on Aug 7th 2020 - when new daily cases
sunk below 350 and daily deaths were down to single digits. Today's daily-deaths rate (20) is 89% below its May 2020 record high (176).
Troubling as today's ultimate projection may be, the alternative natural herd immunity strategy promoted by conspirators would have cost 421,000 Canadian lives (37 million x 67% x 1.7% Alpha/Beta case fatality rate) with no guarantee of permanent immunity.
The model reveals 29K souls (of 42,300 total) will have perished unnecessarily due to
misguided policymaker decisions to prematurely re-open.
Canadian
media (CTV & CBC) annually expose nursing home neglect
and under-staffing, so there's no
surprise this sector saw the most confirmed cases. 69% of Covid19
victims resided or worked in long-term facilities. 88% of
fatalities were over the age of 69.
Canada's mortality rate: 0.10% or 1,021 deaths/million
ONTARIO analysis
The model projects Omicron's BA2/4/5 sub-variants will claim yet another 81 fatalities across Ontario as the present wave expires in September -- based on existing lax policymaker
mitigation. Added to
the current toll (11,873), an ultimate 11,954 victims are projected over 2020-2022. Future variants-of-concern may inflate final numbers.
It reveals Ontario's wave#1 was initially
suppressed on July 7th 2020 - when new daily cases
sunk below 150 and the Province reported its third consecutive
fatality-free day. Today's daily-deaths rate (3) is 96% below its record highs (62) in May 2020.
Troubling as today's ultimate projection may be, the alternative natural herd immunity strategy promoted by conspirators would have cost 171,000 Ontario lives (15 million x 67% x 1.7% Alpha/Beta case fatality rate) with no guarantee of permanent immunity.
The model reveals 10K (of 11,954 total) will have perished unnecessarily due to
misguided policymaker decisions to prematurely re-open.
Finding 66% of its Covid deaths in nursing homes, to Ontario's credit it was one of the first jurisdiction to initiate an
Inquiry Commission to evaluate the crisis in long-term seniors care
facilities.
Ontario's mortality rate: 0.09% or 852 deaths/million
BC analysis
The model
projects Omicron's BA2/4/5 sub-variants will claim yet another 319 fatalities
across the Province as the present wave expires in December -- based on
lax existing policymaker mitigation. Added to the current toll (3,722), an ultimate 4,041 victims are projected over 2020-2022. Future variants-of-concern may inflate final numbers.
It reveals BC's wave#1 was initially
suppressed way
back on June 20th 2020 - when new daily
cases had dwindled to single digits and the Province reported its ninth
consecutive fatality-free day. The
model deemed wave#1 suppressed a second time (late July 2021)
when once again daily-deaths hit single digits. And a third when Delta troughed in early January 2022. Today's daily-deaths rate (9) is down substantially from the record 21/day in December 2020.
Troubling as today's
ultimate projection may be, the alternative natural herd immunity
strategy promoted
by conspirators would have cost 33,500 BC lives (5 million x 67% x 1.0%
Alpha/Beta case fatality rate) with no guarantee of permanent immunity.
The model reveals 2K souls (of 4,041 total) will have perished unnecessarily due to
misguided policymaker decisions to prematurely re-open.
My
analysis of a Canadian Medical Assoc Journal study of Excess Deaths
(June 2022) indicates BC's ultimate Covid fatalities will, upon
reconciliation, be 8,000 -- not the 4K suggested by BC Gov't & CDCBC
official reporting.
This challenges BC's repeated boast of having among the lowest fatality,
mortality & incidence rates across Canada & the globe. But to their credit, while
British Columbia &
Washington State were the
first North American regions to see confirmed cases take off, wise
leadership quickly contained the spread -- before falling victim to
faulty re-opening strategies.
Further credit to BC in being among the first to mandate full vaccination for healthcare workers and bar
family visitations to nursing homes and disallow care workers from attending
multiple long-term residences. Residents of BC long-term facilities comprise 68% of total
fatalities.
BC mortality rate: 0.06% or 587 deaths/million
The TRENDLines Research POST-PEAK LINEARIZATION
MODEL (PPLM)
These six Covid19 projections are generated by TR's linearization
model. It extrapolates a jurisdiction's mortality rate after the curve's peak - particularly the most recent
days & weeks. The graph's data
points move left to right chronologically above its date's cumulative
death toll on the x-axis. The intersection (asymptote) of their
trend line at the x-axis indicates an estimate of the ultimate total
deaths. As daily data points are added, a
high y-axis data point (high mortality rate) will shift the bottom of the
trend line to the right
and a higher fatalities count ... and vice versa.
There is no medical component aside from tracking daily &
cumulative fatalities. This strictly mathematical model analyzes
nuanced gradient changes in
a curve's down-slope and assumes no change in gov't guidelines, orders
or citizenry behaviour. This same methodology has been
one of the criteria by which TRENDLines Research has determined global
& Saudi Arabia oil reserves since 2004. On request, I can similarly chart any Nation,
State, Province or Region - presented alone or with comparatives.
About TRENDLines Research
Data analyst Freddy Hutter of Vancouver Island BC has developed models
& methodologies for macro-economic charts & guidance for
policy-makers, stakeholders. legislators, investors, educators, and the
public with a
long term multi-disciplinary perspective since 1989. TRENDLines
removes the noise in (economic) data to reveal the underlying
trends. Specialties
include: Recession Indicators for Canada, USA & China;
Realty Bubble Indicators for Canada, USA, UK & Australia;
Global Oil Production & Price Component analysis/forecasts; &
national, provincial Party & Presidential political election
projections. Covid-19 ultimate deaths forecasting is the most
recent endeavour.
|
Archive of PPL Model's Projected 2020-2023 Covid19 Fatalities
|
|
BC
|
Ontario |
Canada
|
UK
|
USA
|
World
|
 May 8 2023 May 8 2023
| 6,140 | 15,280 | 53,190
| 241,400
| 1,134,700
| 6.97 million
|
April 11
| 6,510 | 15,120 | 53,340
| 234,000
| 1,135,000
| 6.95 million
|
March 19
| 5,510 | 14,790 | 52,620
| 232,700
| 1,134,000
| 6.90 million
|
Feb 17
| 8,600 | 15,100 | 56,000
| 260,000
| 1,138,000
| 6.91 million
|
Jan 9 2023
| 7,900 | 14,280 | 55,400
| 232,400
| 1,215,000
| 7.50 million
|
Dec 10 2022
| 5,190 | 13,990 | 51,000
| 221,050
| 1,137,000
| 6.89 million
|
Nov 7
| 5,240 | 16,520 | 53,910
| 200,900
| 1,126,000
| 6.75 million
|
Oct 9
| 4,505 | 13,760 | 46,840
| 208,750
| 1,129,000
| 6.67 million
|
Sept 12
| 4,631 | 15,200 | 52,150
| 207,730
| 1,079,000
| 6.78 million
|
| Aug 21 | 4,281 | 12,940 | 46,400
| 208,260
| 1,085,000
| 6.67 million
|
July 31
| 4,050 | 12,390 | 43,470
| 201,270
| 1,076,000
| 6.60 million
|
June 30
| 4,041 | 11,954 | 42,300
| 200,100
| 1,050,300
| 6.42 million
|
May 20
| 3,564 | 13,790 | 42,270
| 200,200
| 1,027,200
| 6.36 million
|
April 8
| 3,066 | 12,750 | 38,470
| 195,650
| 1,015,000
| 6.33 million
|
March 6
| 3,196 | 12,810 | 38,050
| 163,180
| 1,071,000
| 6.31 million
|
February
|
-- Omicron variant surging in all 6 jurisdictions -- |
| January 2022 |
-- Omicron variant surging in all 6 jurisdictions -- |
Dec 18 2021
| 2,488 | 10,700 | 31,190
| 154,200
| 889,000
| 5.8 million
|
Nov 24
| 2,365 | 10,110 | 30,700
| 150,250
| 859,000
| 6.1 million
|
Oct 9
| 2,054 | 9,960 | 29,200
| 141,730
| 773,000
| 5.6 million
|
| September
| -- Delta variant surging in all 6 jurisdictions --
|
August
| -- Delta variant surging in all 6 jurisdictions --
|
July 5
| 1,778 | 9,800 | 27,020
| 128,990
| 621,000
| 4.4 million
|
June 2
| 1,807 | 9,440 | 27,490
| 128,435
| 655,000
| 4.6 million
|
May 3
| 2,257
| 8,600 | 25,820
| 128,200
| 650,000
| 4.3 million
|
April 1
| 1,668
| 7,965 | 24,070
| 127,460
| 584,000
| 7.7 million
|
March 1
| 1,406
| 7,270 | 22,840
| 127,100
| 570,000
| 2.9 million
|
Feb 3
| 1,317
| 7,680 | 22,260
| 129,500
| 520,000
| 2.7 million
|
Jan 18
| 1,250
| 7,810 | 22,700
| 102,700
| 604,000
| 9.0 million
|
Jan 2 2021
| 1,151
| 5,560 | 19,000
| 139,000
| 763,000
| 4.4 million
|
Dec 16 2020
| -
| 4,220 | 15,330
| 89,000
| 599,000
| 3.2 million
|
Nov 20
| -
| - | 13,400
| - | 396,000
| 2.1 million
|
Oct 20
| 412
| 3,540 | 10,800
| 46,500 | 295,000
| 2.0 million
|
Oct 10
| 374
| 3,540 | 9,840
| 44,450 | 289,000
| 2.1 million
|
Sept 30
| 290
| 3,038 | 10,160
| 44,800 | 270,000
| 1.7 million
|
Sept 20
| 437
| 2,947 | 9,895
| 43,840 | 266,000
| 1.7 million
|
Sept 10
| 277
| 2,905 | 9,440
| 42,200 | 245,000
| 1.4 million
|
Sept 5
| 274
| 2,909 |
9,460
| 42,120 |
267,000
| 1.4 million
|
Aug 30
| 216
| 2,929 | 9,450
| 42,230 | 284,000
| 1.4 million
|
Aug 25
| 217
| 2,868 | 9,370
| 42,010 | 269,000
| 1.5 million
|
Aug 20
| 205
| 2,862 | 9,302
| 41,990 | 265,000
| 1.5 million
|
Aug 15
| 204
| 2,851 | 9,100
| 48,600 | 418,000
| 2.1 million
|
Aug 10
| 207
| 2,852 | 9,075
| 48,800 | 377,000
| 2.5 million
|
Aug 5
| 205
| 2,854 | 9,070
| 48,500 | 282,000
| 2.0 million
|
July 30
| 207
| 2,845 | 9,050
| 48,200 | 308,000
| 2.0 million
|
July 25
| 199
| 2,843 | 9,030
| 48,100 | 239,000
| 1.6 million
|
July 20
| 215
| 2,850 | 9,060
| 48,100 | 204,000
| 1.5 million
|
July 15
| 200
| 2,825 | 8,940
| 46,200 | 180,000
| 1.1 million
|
July 10
| 189
| 2,820 | 8,930
| 46,000 | 175,000
| 1.2 million
|
July 5
| 180
| 2,845 | 8,910
| 46,000 | 173,000
| 1.2 million
|
June 30
| 177
| 2,890 | 8,840
| 45,600 | 161,000
| 1.3 million
|
June 25
| 172
| 2,920 | 8,860
| 44,700 | 141,000
| 1.2 million
|
June 21st 2020
Actual Deaths:
|
171
|
2,657 |
8,481
|
42,731 |
122,468
|
472,779
|
June 20 forecasts
for Year 2020
| 170
| 2,810 | 9,000
| 46,800 | 145,000
| 1,145,000
|
June 16
| 170
| 2,940 | 9,660
| 48,900 | 140,000
| 905,000
|
June 12
| 172
| 3,170 | 10,200
| 47,400 | 141,000
| 852,000
|
June 9
| 172
| 3,530 | 9,430
| 49,200 | 134,000
| 640,000
|
June 6
| 191
| 2,770 | 9,700
| 45,500 | 127,000
| 525,000
|
June 3
| 197
| 2,550 | 8,470
| 42,500 | 122,000
| 471,000
|
June 1
| 216
| 2,540 | 8,370
| 42,000 | 122,000
| 466,000
|
May 30
| 225
| 2,530 | 7,990
| 41,600 | 121,000
| 428,000
|
May 28
| 217
| 2,480 | 7,870
| 41,100 | 119,000
| 420,000
|
May 26
| 225
| 2,390 | 7,590
| 41,600 | 119,000
| 420,000
|
May 24
| 224
|
|
7,470
|
|
120,000
| 420,000
|
May 22
| 223
|
|
7,300
|
|
117,000
| 409,000
|
May 20
| 196
|
|
7,040
|
|
111,000
| 403,000
|
May 18
| 193
|
|
7,135
|
|
110,000
| 406,000
|
May 16
| 180
|
|
7,125
|
|
111,000
| 396,000
|
May 14
| 174
|
|
7,025
|
|
109,000
| 381,000
|
May 12
| 189
|
|
6,850
|
|
105,000
| 386,000
|
May 10
| 222
|
|
6,900
|
|
116,000
| 393,000
|
May 8
| 183
|
|
6,860
|
|
119,000
| 339,000
|
May 6
| 202
|
|
6,475
|
|
103,000
| 352,000
|
May 4
|
200
|
|
6,000
|
|
95,000
|
386,000
|
May 2
|
205
|
|
5,900
|
|
117,000
|
380,000
|
Apr 30 2020
|
238
|
|
5,120
|
|
80,000
|
380,000
|
Apr 28 forecasts
for June 21st 2020
|
176
|
|
3,960
|
|
70,500
|
314,000
|
TRUMP-VIRUS THRUST USA ECONOMY into TECHNICAL RECESSION in MARCH 2020
Dec 18th 2021 update - So how did the USA embark on this historic
crisis? Here's a clue: During a White House Rose Garden
virtual town hall on March 25th 2020, the President stated to the Fox
News host:
"You'll
have packed churches all over the country. It would be a
resurrection of biblical proportions. I would love to have the
country opened up and raring to go by Easter. It would be a
beautiful thing. "Our country has to get back to work, otherwise it's
going to be very hard to start it up again. We can't lose the
advantage we have."
It was on this precise day America
was infected with "the TrumpVirus". On that day the USA had
only 4% of global Covid deaths - apropos considering the nation has 4% of the
world's population.
But it marked the day everything
changed. And leads one to ask why does the USA have 23%
of world's cumulative Covid
cases, 56% of the today's global "active" cases & 24% of worldwide body bags? The answer is founded in its
citizenry electing
a reality show celebrity as its President. This business con man's failure to
mitigate Covid-19's spread runs the length of his stay in office.
Albeit Obama's Homeland Security
Chief (Lisa Monaco) briefed the incoming transition team with a robust
"playbook", un-indicted Individual-1 shut down the White House's
National Security Council's Pandemic Unit in 2018. Dr Dennis
Carol's Predict Program was cancelled by the White House in 2019.
And 'cuz their very public warnings were rocking the stock markets in
Feb/2020, CDC's renowned disease experts Sarah Messonnier & Dr
Bright were abruptly reassigned.
This prudent planning team was replaced by a muse "this flu will just go
away with warm April sunshine". After his "miracle"
failed, the self-proclaimed "extremely stable genius" offered his cult following hydroxychloroquine, disinfectant injections and internal UV light
remedies.
It was soon evident many continued to
drink the
Kool-Aid (or bleach?). Prior to flattening their curves, mostly
"red States" relaxed physical distancing, stay-at-home policies, masking &
contact tracing.
From the onset it was evident Trump's "Opening Up
America Again"
campaign was rooted in politics. Despite
his bravado, to that point in time he failed to attain Obama's multiple
5% GDP growth rates. 2020's Q1/Q2/Q3 were his last-kick-at-the-can
- hence his nonsensical dampened pandemic rhetoric thru January,
February & March. With Q1 going negative (-5%), he knew a large part
of his Nov/2020 Election demise rested on Q2 & Q3 GDP.
So the
motive for his March 25th plea (above) for Easter church goers to
return to work April 14th is clear. As a ratings savvy guy, he
knew Q2 GDP (for Apr/May/June) would be
announced in late July (with Aug27th & Sept30th revisions). The Q3
GDP announcement was Oct29th - a mere five days prior to Election Day (Nov3rd).
And
evidently, he's in huge trouble for failing to contain Covid-19.
The uncontained TrumpVirus resulted in GDP crashing at a historic -31%
pace in Q2. And of
the 75 million workers initiating unemployment claims due to the pandemic during his term, 2.5
million remain on the rolls (1.7 mil pre-pandemic). With no sign of his boasted
V-shaped
Recovery, Individual-1 tried some desperate manoeuvres ... like forcing
schools to
re-open ... attempting to postpone the Election ... sabotaging the
postal system for an
electoral advantage ... and challenging those mail-in ballots and
finally ... recruiting nationalist militia to overthrow the Capitol on
January 6th.
The President caused a TrumpVirus resurgence only for the purpose of salvaging his legacy. He
desperately wanted to avoid voters going to the polls realizing The Donald (alone)
was at fault for April's 22% U-6 Unemployment Rate & plunging
the U.S. economy into its deepest crash (-31% GDP) ever - including the Great Depression.
The TRENDLines
Recession Indicator was the
first macro-economic model to accurately reveal the magnitude of the Great Recession in real
time. In the 2013 chart below, TRI was forecasting a USA austerity
crisis to occur in
2024 due to an uncontrolled $26 trillion National Debt. But that
day was pre-empted by a black swan event: the TrumpVirus - a
crisis of epic proportions in mismanagement, lack of containment &
mitigation failures - resulting in 815,000 fatalities (thus far).
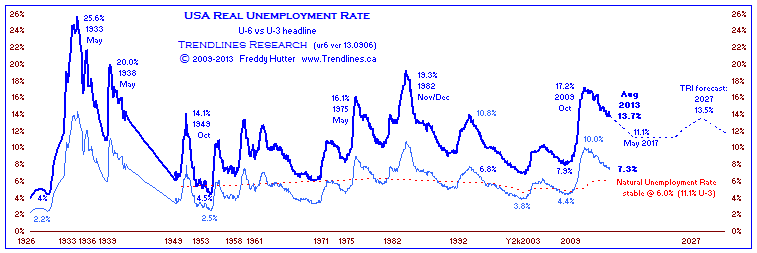
Despite interventions by the Federal Reserve via its monetary policy tool
box and fiscal policy injections of trillions of dollars by Congress, it
is probable the American economy will suffer long-term
consequences. April's "real" Unemployment Rate (U-6) of 22%
was the worst since the 26% high (1933) in the Great Depression (see
chart below). Q2GDP plunged 31% (annualized rate), dwarfing the 2008 & 1980
downturns and anything seen in the great Depression.
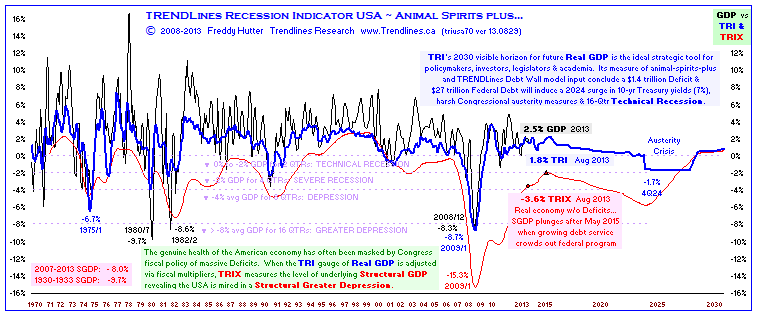
the traditional definitions
TECHNICAL RECESSION:
Avg Gross Domestic Product growth rate (GDP) declines 0% to 2% for at
least 2 Quarters within an environment of rising unemployment.
SEVERE RECESSION: Avg GDP declines 2% to 4% for at least 4 Qtrs (1 yr)
DEPRESSION: Avg GDP declines 4% to 8% for at least 8 Qtrs (2 yrs)
GREATER DEPRESSION: Avg GDP declines over 8% for at least 16 Qtrs (4 yrs)
RECOVERY PERIOD: monthly/quarterly nominal GDP expanding but remains below pre-contraction peak
EXPANSION PERIOD: monthly/quarterly nominal GDP finally exceeds pre-contraction peak
STRUCTURAL GDP (TRIX): Real GDP adjusted for Fiscal Policy Deficit/Surplus effects to reveal growth rate of underlying economy
UPPER CLASS: family wealth (net worth) is among the top 1% of society
MIDDLE CLASS: family income is among the top 10% of society
WORKING CLASS: all the rest...
U-6 UNEMPLOYMENT RATE:
Marginally attached workers are persons who currently are neither
working nor looking for work but indicate that they want and are
available for a job and have looked for work sometime in the recent
past. Discouraged workers a subset of marginally attached,
have given a job-market related reason for not looking currently for a
job. Persons employed part time for economic reasons are those who
want and are available for full-time work but have had to settle for a
part-time schedule.
|
|
|
|
| START
FINISH
|
|
|
|
|
|
|
~
send
email to
Freddy Hutter
with questions, comments or navigation corrections with respect to
this web site
~
Last modified: May 8 2023
~ (© 1989-2023 TRENDLines Research)
|
|
keywords: projection prediction forecast indicate guess estimate how many people will
die perish in bc british columbia canada canadians usa
americans united states globe world worldwide earth result from corona virus covid-19
pandemic flu death toll daily total cumulative fatalities perish
victims trendlines freddy hutter CDC IHME model pplm post-peak
linearization social physical distancing
|
|
|
|
TRENDLines Research's
YUKON PROTOCOL
for the UN's
CLIMATE FINANCE DELIVERY PLAN
& its GREEN CLIMATE FUND
Nov 24th 2021 - TRENDLines
Research published its "Yukon Protocol" on Aug 23 2009 to provide guidance to the UNFCCC (United Nations Framework Convention on Climate Change)
and policymakers of developed nations in establishing equitable
contributions wrt the $100 billion Climate Finance Delivery
Plan -- reaffirmed at COP26-Glasgow-2021.
As background, after each of the UN's IPCC (Intergovernmental Panel on Climate Change) reports,
developing nations begrudged demands on them to forego economical coal, oil and gases as their gracious part in "saving the planet".
Their objections are founded in
the perceived
unfairness that while today's wealthy nations achieved their status in
part via industrialization under a high emissions regime, the latter has
undergone an epiphany of sorts and so to suppress imminent climate
change due to past sins, they now chastise developing nations for
utilizing those same efficient fossil fuel resources to foster their
growth.
So as a fairness measure to offset
the cost burden of low emission infrastructure in young economies,
COP15-Copenhagen-2009 proposed a Green Climate Fund (GCF) from which
they can draw upon -- and to be funded by mature nations.
Subsequent COP's (Conference Of the Parties) established the GCF, but a dozen years on, donor nations continue a struggle to find equitable contribution levels.
TR's Yukon Protocol suggests a
truly relevant apportionment of the $100 billion Climate Finance
Delivery Plan rests in setting national contributions in accordance to
each country's share of cumulative co2 emissions.
The
Yukon Protocol's latest methodology divides up the $100 billion Climate
Finance target among the top 100 co2 emitters using their known prorated
share of cumulative emissions (since Year 1750). Said 100 are
responsible for 97% of total emissions for this period. The
remaining 114 nations are candidates for GCF grants & loans.
With full compliance, annual contributions within the Protocol range from $31 million assessed against Jamaica - the
lowest of the 100 top emitters (0.03%) to $25.65 billion due from
the largest - the USA (25.65%). Over 2/3 of the target is achieved levying the top ten emitters.
Credit to CDIAC, GCP & OWID acknowledged as data sources.
link to 5pg printable PDF
YUKON PROTOCOL FOR CLIMATE FINANCE
DELIVERY PLAN
|
Top 100
emitter nations
|
funding proportion based on cumulative co2 emissions
|
assessed share of
$100 billion target
|
emitter rating
|
|
|
|
|
|
|
United
States
|
25.65%
|
$25,651,095,494
|
1
|
|
China
|
13.76%
|
$13,755,684,167
|
2
|
|
Russia
|
7.12%
|
$7,120,711,038
|
3
|
|
Germany
|
5.75%
|
$5,746,176,106
|
4
|
|
United
Kingdom
|
4.87%
|
$4,867,713,931
|
5
|
|
Japan
|
4.04%
|
$4,040,926,002
|
6
|
|
India
|
3.25%
|
$3,245,142,621
|
7
|
|
France
|
2.39%
|
$2,387,350,145
|
8
|
|
Canada
|
2.07%
|
$2,066,969,822
|
9
|
|
Ukraine
|
1.85%
|
$1,849,937,991
|
10
|
|
Poland
|
1.73%
|
$1,725,919,802
|
11
|
|
Italy
|
1.52%
|
$1,519,222,819
|
12
|
|
South
Africa
|
1.29%
|
$1,291,856,139
|
13
|
|
Mexico
|
1.24%
|
$1,240,181,893
|
14
|
|
Iran
|
1.15%
|
$1,147,168,251
|
15
|
|
Australia
|
1.14%
|
$1,136,833,402
|
16
|
|
South
Korea
|
1.06%
|
$1,064,489,458
|
17
|
|
Brazil
|
0.95%
|
$950,806,118
|
18
|
|
Saudi
Arabia
|
0.93%
|
$930,136,420
|
19
|
|
Spain
|
0.92%
|
$919,801,571
|
20
|
|
Indonesia
|
0.85%
|
$847,457,627
|
21
|
|
Kazakhstan
|
0.84%
|
$837,122,778
|
22
|
|
Belgium
|
0.78%
|
$775,113,683
|
23
|
|
Czechia
|
0.74%
|
$744,109,136
|
24
|
|
Netherlands
|
0.72%
|
$723,439,438
|
25
|
|
Turkey
|
0.65%
|
$651,095,494
|
26
|
|
Taiwan
|
0.54%
|
$537,412,154
|
27
|
|
Romania
|
0.53%
|
$527,077,305
|
28
|
|
Argentina
|
0.52%
|
$516,742,456
|
29
|
|
Venezuela
|
0.49%
|
$485,737,908
|
30
|
|
Thailand
|
0.44%
|
$444,398,512
|
31
|
|
Uzbekistan
|
0.41%
|
$413,393,964
|
32
|
|
Egypt
|
0.38%
|
$382,389,417
|
33
|
|
Malaysia
|
0.36%
|
$361,719,719
|
34
|
|
Austria
|
0.34%
|
$341,050,021
|
35
|
|
Belarus
|
0.33%
|
$330,715,172
|
36
|
|
North
Korea
|
0.32%
|
$320,380,322
|
37
|
|
Hungary
|
0.31%
|
$310,045,473
|
38
|
|
Pakistan
|
0.31%
|
$310,045,473
|
38
|
|
Sweden
|
0.31%
|
$310,045,473
|
38
|
|
United
Arab Emirates
|
0.29%
|
$289,375,775
|
41
|
|
Algeria
|
0.28%
|
$279,040,926
|
42
|
|
Iraq
|
0.28%
|
$279,040,926
|
43
|
|
Denmark
|
0.26%
|
$258,371,228
|
44
|
|
Greece
|
0.25%
|
$248,036,379
|
45
|
|
Bulgaria
|
0.24%
|
$237,701,530
|
46
|
|
Nigeria
|
0.24%
|
$237,701,530
|
46
|
|
Slovakia
|
0.24%
|
$237,701,530
|
46
|
|
Vietnam
|
0.23%
|
$227,366,680
|
49
|
|
Colombia
|
0.21%
|
$206,696,982
|
50
|
|
Philippines
|
0.21%
|
$206,696,982
|
50
|
|
Finland
|
0.20%
|
$196,362,133
|
52
|
|
Switzerland
|
0.19%
|
$186,027,284
|
53
|
|
Chile
|
0.18%
|
$175,692,435
|
54
|
|
Kuwait
|
0.18%
|
$175,692,435
|
54
|
|
Serbia
|
0.18%
|
$175,692,435
|
54
|
|
Azerbaijan
|
0.17%
|
$165,357,586
|
57
|
|
Norway
|
0.17%
|
$165,357,586
|
57
|
|
Portugal
|
0.17%
|
$165,357,586
|
57
|
|
Turkmenistan
|
0.17%
|
$165,357,586
|
57
|
|
Israel
|
0.14%
|
$144,687,888
|
61
|
|
Ireland
|
0.13%
|
$134,353,038
|
62
|
|
Singapore
|
0.13%
|
$134,353,038
|
62
|
|
Libya
|
0.12%
|
$124,018,189
|
64
|
|
Qatar
|
0.12%
|
$124,018,189
|
64
|
|
New
Zealand
|
0.11%
|
$113,683,340
|
66
|
|
Peru
|
0.11%
|
$113,683,340
|
66
|
|
Syria
|
0.11%
|
$113,683,340
|
66
|
|
Cuba
|
0.10%
|
$103,348,491
|
69
|
|
Hong
Kong
|
0.10%
|
$103,348,491
|
69
|
|
Morocco
|
0.10%
|
$103,348,491
|
69
|
|
Bangladesh
|
0.09%
|
$93,013,642
|
72
|
|
Estonia
|
0.09%
|
$93,013,642
|
72
|
|
Trinidad
& Tobago
|
0.09%
|
$93,013,642
|
72
|
|
Lithuania
|
0.08%
|
$82,678,793
|
75
|
|
Croatia
|
0.07%
|
$72,343,944
|
76
|
|
Ecuador
|
0.07%
|
$72,343,944
|
76
|
|
Oman
|
0.07%
|
$72,343,944
|
76
|
|
Bosnia
& Herzegovina
|
0.06%
|
$62,009,095
|
79
|
|
Georgia
|
0.06%
|
$62,009,095
|
79
|
|
Moldova
|
0.06%
|
$62,009,095
|
79
|
|
Bahrain
|
0.05%
|
$51,674,246
|
82
|
|
Kyrgyzstan
|
0.05%
|
$51,674,246
|
82
|
|
Latvia
|
0.05%
|
$51,674,246
|
82
|
|
Luxembourg
|
0.05%
|
$51,674,246
|
82
|
|
Slovenia
|
0.05%
|
$51,674,246
|
82
|
|
Tunisia
|
0.05%
|
$51,674,246
|
82
|
|
Zimbabwe
|
0.05%
|
$51,674,246
|
82
|
|
Angola
|
0.04%
|
$41,339,396
|
89
|
|
Armenia
|
0.04%
|
$41,339,396
|
89
|
|
Dominican
Republic
|
0.04%
|
$41,339,396
|
89
|
|
Jordan
|
0.04%
|
$41,339,396
|
89
|
|
Lebanon
|
0.04%
|
$41,339,396
|
89
|
|
Mongolia
|
0.04%
|
$41,339,396
|
89
|
|
North
Macedonia
|
0.04%
|
$41,339,396
|
89
|
|
Yemen
|
0.04%
|
$41,339,396
|
89
|
|
Bolivia
|
0.03%
|
$31,004,547
|
97
|
|
Curacao
|
0.03%
|
$31,004,547
|
97
|
|
Guatemala
|
0.03%
|
$31,004,547
|
97
|
|
Jamaica
|
0.03%
|
$31,004,547
|
97
|
|
|
100.00%
|
|
assessed nations:
|
|
ver 21.1116
|
100.00%
|
$100,000,000,000
|
100
|
|
|
|
|
|
|
|
|
|
|
|
114
Recipient Entities:
|
|
|
|
|
|
|
|
|
|
Kenya
|
|
|
|
|
Myanmar
|
|
|
|
|
Sri
Lanka
|
|
|
|
|
Sudan
|
|
|
|
|
Tajikistan
|
|
|
|
|
Albania
|
|
|
|
|
Brunei
|
|
|
|
|
Cote
d'Ivoire
|
|
|
|
|
Cyprus
|
|
|
|
|
Gabon
|
|
|
|
|
Ghana
|
|
|
|
|
Honduras
|
|
|
|
|
Panama
|
|
|
|
|
Uruguay
|
|
|
|
|
Afghanistan
|
|
|
|
|
Bahamas
|
|
|
|
|
Benin
|
|
|
|
|
Botswana
|
|
|
|
|
Cambodia
|
|
|
|
|
Cameroon
|
|
|
|
|
Costa
Rica
|
|
|
|
|
Democratic
Republic of Congo
|
|
|
|
|
El
Salvador
|
|
|
|
|
Equatorial
Guinea
|
|
|
|
|
Ethiopia
|
|
|
|
|
Guyana
|
|
|
|
|
Iceland
|
|
|
|
|
Kosovo
|
|
|
|
|
Laos
|
|
|
|
|
Madagascar
|
|
|
|
|
Malta
|
|
|
|
|
Mauritius
|
|
|
|
|
Montenegro
|
|
|
|
|
Mozambique
|
|
|
|
|
Nepal
|
|
|
|
|
New
Caledonia
|
|
|
|
|
Nicaragua
|
|
|
|
|
Papua
New Guinea
|
|
|
|
|
Paraguay
|
|
|
|
|
Senegal
|
|
|
|
|
Suriname
|
|
|
|
|
Tanzania
|
|
|
|
|
Uganda
|
|
|
|
|
Zambia
|
|
|
|
|
Andorra
|
|
|
|
|
Anguilla
|
|
|
|
|
Antigua
& Barbuda
|
|
|
|
|
Aruba
|
|
|
|
|
Barbados
|
|
|
|
|
Belize
|
|
|
|
|
Bermuda
|
|
|
|
|
Bhutan
|
|
|
|
|
Bonaire
Sint Eustatius & Saba
|
|
|
|
|
British
Virgin Islands
|
|
|
|
|
Burkina
Faso
|
|
|
|
|
Burundi
|
|
|
|
|
Cape
Verde
|
|
|
|
|
Central
African Republic
|
|
|
|
|
Chad
|
|
|
|
|
Comoros
|
|
|
|
|
Congo
|
|
|
|
|
Cook
Islands
|
|
|
|
|
Djibouti
|
|
|
|
|
Dominica
|
|
|
|
|
Eritrea
|
|
|
|
|
Eswatini
|
|
|
|
|
Faeroe
Islands
|
|
|
|
|
Fiji
|
|
|
|
|
French
Polynesia
|
|
|
|
|
Gambia
|
|
|
|
|
Greenland
|
|
|
|
|
Grenada
|
|
|
|
|
Guinea
|
|
|
|
|
Guinea-Bissau
|
|
|
|
|
Haiti
|
|
|
|
|
Kiribati
|
|
|
|
|
Lesotho
|
|
|
|
|
Liberia
|
|
|
|
|
Liechtenstein
|
|
|
|
|
Macao
|
|
|
|
|
Malawi
|
|
|
|
|
Maldives
|
|
|
|
|
Mali
|
|
|
|
|
Marshall
Islands
|
|
|
|
|
Mauritania
|
|
|
|
|
Micronesia
|
|
|
|
|
Montserrat
|
|
|
|
|
Namibia
|
|
|
|
|
Nauru
|
|
|
|
|
Niger
|
|
|
|
|
Niue
|
|
|
|
|
Palau
|
|
|
|
|
Palestine
|
|
|
|
|
Rwanda
|
|
|
|
|
Saint
Helena
|
|
|
|
|
Saint
Kitts & Nevis
|
|
|
|
|
Saint
Lucia
|
|
|
|
|
Saint
Pierre & Miquelon
|
|
|
|
|
Saint
Vincent & Grenadines
|
|
|
|
|
Samoa
|
|
|
|
|
Sao
Tome & Principe
|
|
|
|
|
Seychelles
|
|
|
|
|
Sierra
Leone
|
|
|
|
|
Sint
Maarten (Dutch)
|
|
|
|
|
Solomon
Islands
|
|
|
|
|
Somalia
|
|
|
|
|
South
Sudan
|
|
|
|
|
Timor
|
|
|
|
|
Togo
|
|
|
|
|
Tonga
|
|
|
|
|
Turks
& Caicos Islands
|
|
|
|
|
Tuvalu
|
|
|
|
|
Vanuatu
|
|
|
|
|
Wallis
& Futuna
|
|
|
|
|
|
About TRENDLines Research
Data analyst Freddy Hutter of Vancouver Island BC has developed models
& methodologies for macro-economic charts & guidance for
policy-makers, stakeholders. legislators, investors, educators, and the public with a
long term multi-disciplinary perspective since 1989. TRENDLines
removes the noise in (economic) data to reveal the underlying
trends. Specialties
include: Recession Indicators for Canada, USA & China;
Realty Bubble Indicators for Canada, USA, UK & Australia;
Global Oil Production & Price Component analysis/forecasts;
& national, provincial Party & Presidential political election
projections. Covid-19 ultimate deaths forecasting is the most recent endeavour.
|
|
|
|
|
~
-
the FreeVenue
chart-of-the-day is a public posting of guidance (charts, tables
& analysis)
-
Trendlines
Research has been publishing charts & analysis relating to Peak
Oil, Macro-Economics, Climate Change & Political Election
Projections since 1989. Data analyst Freddy Hutter's media
and professional commentary on these issues commenced in 1973
- all charts, tables & text © 1989-2021 all rights reserved TRENDLines Research
|
~ |
|

|
|

 |
|
|
clik to follow @TrendlinesDotCa for new chart alerts |
|
|
|